Capnography in EMS:
why it’s your second monitor
The opening article of the series. From the physics of CO₂ to clinical decision-making — what EtCO₂ tells you about a patient’s ventilation, perfusion, and metabolism in real time.
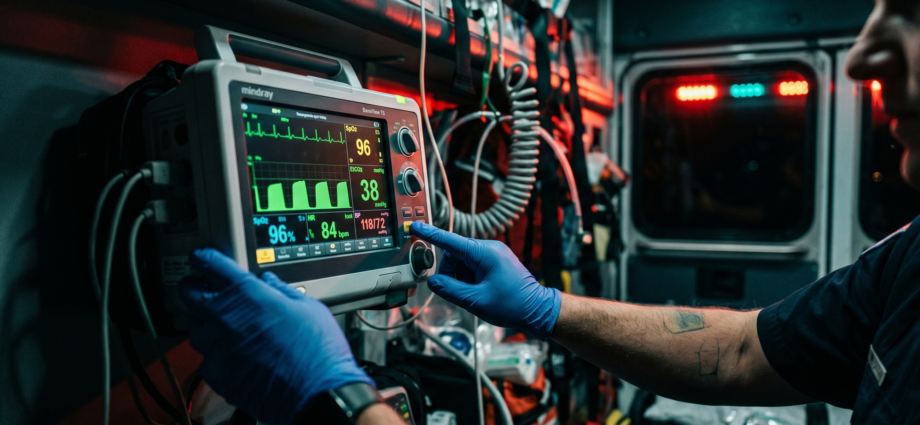
Every EMS crew’s monitor has a pulse oximeter. Most also have a capnograph. But while everyone watches SpO₂, the EtCO₂ waveform on the second channel tends to be either ignored or misunderstood. This article is the first installment of a series that will show you why capnography may be a more important monitoring parameter than pulse oximetry — and why you should be reading it on every single call.
What capnography actually measures
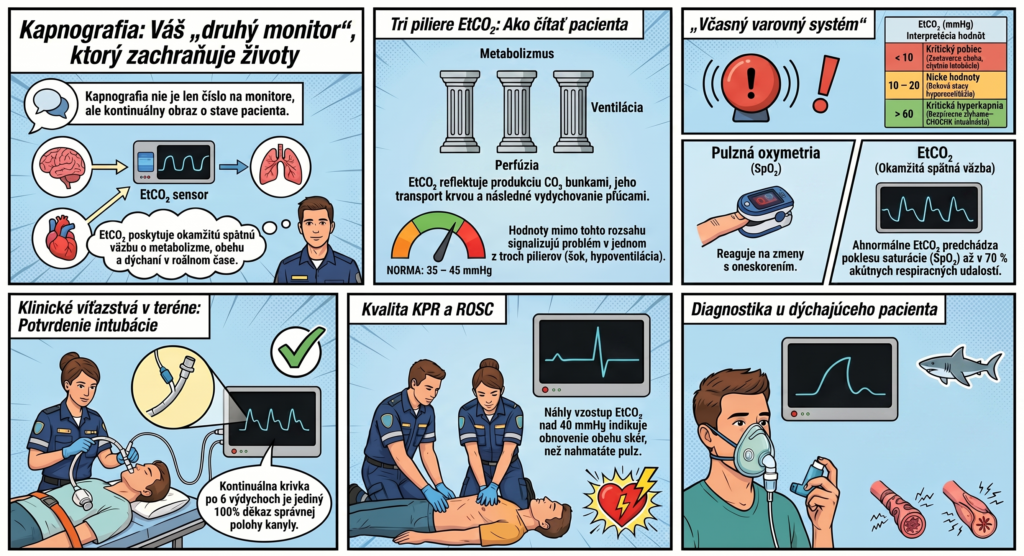
Capnography is the continuous measurement of carbon dioxide (CO₂) concentration in exhaled air. The result is both a numeric value — EtCO₂ (end-tidal CO₂), the partial pressure of CO₂ at the end of exhalation — and a graphical waveform, the capnogram, which shows how that concentration changes over the breathing cycle.
The key is understanding what CO₂ represents in the body. Carbon dioxide is a waste product of cellular metabolism. It’s produced in tissues, travels through the blood to the lungs, and is exhaled. This transport depends on three independent processes:
1. Metabolism — how much CO₂ cells produce (depends on temperature, activity, fever, hypothermia)
2. Perfusion — how well the blood transports CO₂ from the tissues to the lungs (cardiac output, shock, circulatory arrest)
3. Ventilation — how effectively the lungs exhale CO₂ (respiratory rate, tidal volume, dead space)
This is exactly why EtCO₂ is so valuable: every change in value or waveform shape reflects a change in one of these three pillars. If you know which pillar is affected, you have diagnostic information that a pulse oximeter simply cannot provide.
Normal values and their clinical context
The normal EtCO₂ value in a spontaneously breathing adult ranges between 35 and 45 mmHg. One essential clinical note must be added immediately: EtCO₂ is not identical to PaCO₂ — arterial CO₂ pressure.
Reason: exhaled air isn’t pure alveolar air — it’s diluted by dead space (both anatomical and physiological), which contains no CO₂. The typical gradient (PaCO₂ − EtCO₂) in a healthy patient is 2–5 mmHg.
In patients with lung disease (COPD, embolism, edema), this gradient can widen significantly — EtCO₂ then underestimates the true PaCO₂. This must be kept in mind in the prehospital setting, but clinical decisions shouldn’t be based on the absolute number alone — watch the trend and the waveform shape.
| EtCO₂ (mmHg) | Clinical interpretation | Typical causes in EMS |
|---|---|---|
| < 10 | Critical drop — perfusion failure or ventilation with zero CO₂ | Cardiac arrest, esophageal intubation, massive PE |
| 10–20 | Low — severe hypoperfusion or hyperventilation | Shock, hyperventilation syndrome, DKA (compensatory) |
| 20–35 | Low-normal — watch the context | Mild hyperventilation, metabolic acidosis, anxiety |
| 35–45 | NORMAL | Physiological ventilation and perfusion |
| 45–60 | Elevated — hypoventilation or increased CO₂ production | Obesity, sedation, chronic retention (COPD), sepsis |
| > 60 | Critical hypercapnia — respiratory failure imminent | COPD exacerbation, severe hypoventilation, sedative intoxication |
Anatomy of the capnographic waveform
The numeric EtCO₂ value alone is only half the information. The second half, equally clinically valuable, is the waveform shape — the capnogram. Each phase of the waveform corresponds to a specific physiological event.
Baseline
Upstroke
Plateau
Downstroke
Why capnography beats pulse oximetry in certain situations
This isn’t a call to abandon SpO₂ monitoring — both parameters are irreplaceable and complement each other. It’s about understanding where capnography has a clear edge:
1. Capnography detects deterioration FASTER than SpO₂
Pulse oximetry is a delayed indicator. When a patient stops ventilating adequately, EtCO₂ changes immediately — but oxygen saturation can remain normal for several more minutes, particularly if the patient is on supplemental O₂. Studies show that an abnormal EtCO₂ precedes a drop in SpO₂ or clinically observable hypoventilation in up to 70% of acute respiratory events.
You give 10 mg IV diazepam for seizures. The patient is breathing, SpO₂ = 97% (on 10 L/min O₂). Seemingly stable.
Yet EtCO₂ rises from 38 to 58 mmHg over 3 minutes, and the waveform slows. This is a warning — SpO₂ hasn’t reacted yet, but ventilation is failing. You have time to act: reduce the dose, prepare the BVM, consider flumazenil.
2. Capnography is the gold standard for confirming intubation
Every paramedic who intubates should know this: continuous waveform capnography is the only reliable method for confirming correct endotracheal tube placement in the prehospital setting. Auscultation is unreliable (ambulance noise, anatomical variation). Capnography is not — esophageal intubation produces at most 2–3 waveforms from residual gastric CO₂, after which the signal disappears.
After an esophageal intubation, you may briefly see an EtCO₂ of 10–20 mmHg from CO₂ in the stomach. This DISAPPEARS after 3–4 compression cycles or breaths.
Rule: a persistent, regular capnographic waveform after 6 breaths = correct tube placement. No other method in the prehospital setting reliably replaces this.
3. Capnography in CPR — real-time resuscitation quality
During cardiopulmonary resuscitation, EtCO₂ is a direct indicator of chest compression quality. CO₂ only reaches the lungs if the heart (or its substitute — external compressions) is pumping blood. A low EtCO₂ during CPR means either poor cardiac output from compressions or improper technique.
| EtCO₂ during CPR | Interpretation | Action |
|---|---|---|
| < 10 mmHg | Inadequate perfusion — poor compressions or poor venous return | Check technique, depth, compression rate; rule out tension pneumothorax |
| 10–20 mmHg | Borderline — monitor the trend | Optimize compressions, consider reversible causes (4Hs/4Ts) |
| > 20 mmHg | Adequate perfusion during CPR | Maintain quality, watch for a sudden rise |
| Sudden rise > 40 mmHg | ROSC — return of spontaneous circulation | Immediately check for a pulse, adjust management |
A sudden rise in EtCO₂ above 40 mmHg during CPR is one of the most reliable prehospital signs of ROSC — and the paramedic will spot it on the monitor even before they manage to palpate a pulse.
Capnography in the spontaneously breathing, non-intubated patient
Many paramedics think capnography is relevant only for intubated patients. The opposite is true. A nasal capnography cannula enables continuous monitoring of ventilatory status in any patient who is breathing — and this is exactly where an enormous, systematically underused clinical potential lies in prehospital practice.
Altered consciousness of unknown etiology: Low EtCO₂ with fast respiratory rate → Kussmaul breathing → DKA. High EtCO₂ with slow rate → hypoventilation → opioid intoxication, hypoglycemia.
Status epilepticus: After giving a benzodiazepine — EtCO₂ shows you whether ventilation remains adequate. SpO₂ hasn’t reacted yet.
Respiratory distress — asthma vs. COPD: Waveform shape (shark fin = obstruction) plus EtCO₂ value (CO₂ retention in COPD) helps differentiate and guide O₂ therapy.
Hyperventilation syndrome: EtCO₂ of 20–25 mmHg plus normal SpO₂ plus the clinical picture → confirms the diagnosis without needing a D-dimer in the field.
Technical aspects — what the paramedic needs to know about measurement
Capnography works on the principle of infrared light absorption — CO₂ absorbs a specific IR wavelength, and the degree of absorption is directly proportional to CO₂ concentration. Two types of measurement systems are used in the prehospital setting:
Sidestream — air is drawn through a thin tube into a measuring chamber outside the airway. Allows use of a nasal cannula in a spontaneously breathing patient. Downside: signal delay and moisture-condensation risk in the tubing (blockage).
Mainstream — the sensor sits directly in the breathing circuit (typically between the ET tube and the BVM/ventilator). Faster signal, suited to intubated patients. Downside: adds dead space and weight to the tube.
The most common mistake in the field: using capnography only during intubation and disconnecting it once tube placement is confirmed. Capnography should stay connected throughout the entire transport — this lets you monitor not just tube position, but also the patient’s ongoing hemodynamic state.
What to expect in the rest of the series
This opening article laid the physiological groundwork. In the coming installments, we’ll look at specific clinical scenarios paramedics encounter on calls:
- Capnography in EMS: why it’s your second monitor (this article)
- The normal capnographic waveform and its clinical interpretation — phase by phase
- Capnography during CPR: reading resuscitation quality in real time
- Capnography traps: when the waveform lies — esophageal intubation, bronchospasm, artifact
- EtCO₂ and the decision to terminate CPR: when to continue and when not to
- Capnography in the spontaneously breathing patient — opioid intoxication, status epilepticus, DKA
- Bhavani-Shankar K, Moseley H, Kumar AY, Delph Y. Capnometry and Anaesthesia. Can J Anaesth. 1992;39(6):617–632. doi:10.1007/BF03008330
- Silvestri S, et al. The Effectiveness of Out-of-Hospital Use of Continuous End-Tidal Carbon Dioxide Monitoring on the Rate of Unrecognized Misplaced Intubation. Ann Emerg Med. 2005;45(5):497–503.
- Meaney PA, et al. Cardiopulmonary Resuscitation Quality: Improving Cardiac Resuscitation Outcomes Both Inside and Outside the Hospital. Circulation. 2013;128(4):417–435.
- Cantineau JP, et al. End-Tidal Carbon Dioxide During Cardiopulmonary Resuscitation in Humans Presenting Mostly with Asystole. Crit Care Med. 1996;24(5):791–796.
- Perkins GD, et al. European Resuscitation Council Guidelines 2021: Executive Summary. Resuscitation. 2021;161:1–60. doi:10.1016/j.resuscitation.2021.02.003
- StatPearls. Capnography and Respiratory Monitoring. NCBI Bookshelf. Updated 2023. Available at: https://www.ncbi.nlm.nih.gov/books/NBK539754/
- EMS1 Editorial Team. Capnography waveforms and ETCO2: 5 key facts for EMS providers. EMS1.com. June 2025.
- EMCrit Project. Waveform Capnography in the Intubated Patient. emcrit.org. Updated December 2024.
Paramedic with more than 15 years of experience in prehospital emergency care, RZP Leopoldov. Administrator and editor of zachranarjecool.eu. Author of the Capnography in EMS series.