Capnography traps:
when the waveform lies
Capnography is a powerful tool — but not an infallible one. Five situations exist where EtCO₂ can actively mislead the paramedic. Knowing them isn’t optional.
The previous three installments of this series taught us to read the capnogram and to trust it. This installment is about the opposite — the moments when uncritical trust in the capnograph leads to mistakes with a direct impact on the patient. Each of the following traps is documented in the clinical literature. Each has happened in the prehospital setting.
Trap 1 — Esophageal intubation with a false-positive EtCO₂
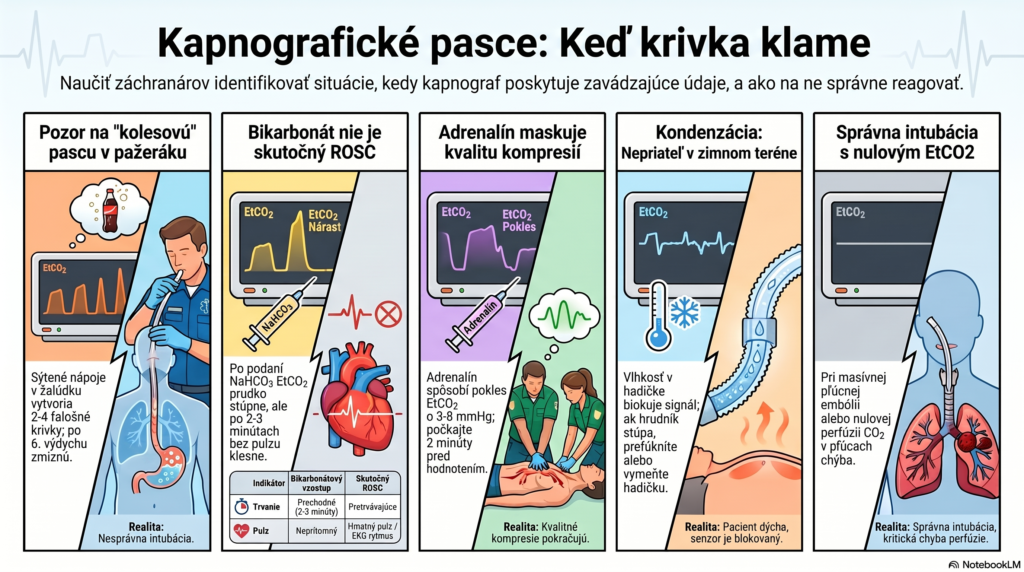
This is the most dangerous capnography trap. After esophageal intubation, 2 to 4 capnographic waveforms with an EtCO₂ of 10–20 mmHg can appear. The source is CO₂ from the stomach — particularly if the patient drank carbonated beverages, ate, or was given bicarbonate before the arrest.
Experimental animal studies confirmed that esophageal intubation after consuming carbonated beverages can produce false-positive capnographic waveforms — but these waveforms differ morphologically from tracheal ventilation waveforms. The problem arises when the paramedic watches only the number and not the waveform’s shape and trend.
A persistent, morphologically correct capnographic waveform after 6 or more breaths = tracheal intubation.
Waveforms in esophageal intubation: irregular, rapidly declining, and disappearing after 3–4 breaths. They never persist.
A meta-analysis of 2,192 intubations showed that capnography has 93% sensitivity and 97% specificity for confirming ET tube placement — meaning it isn’t infallible. Always combine capnography with direct visualization and auscultation — never rely on a single parameter.
After 30 seconds the waveforms disappear, EtCO₂ = 0. Esophageal intubation. The patient had drunk a liter of cola before collapsing. Time lost: 45 seconds of ventilating into the esophagus.
Correct approach: with the first waveforms, immediately watch whether they persist and have the correct shape. At the slightest doubt — laryngoscope and direct visualization.
Trap 2 — Bicarbonate raises EtCO₂ — it’s not ROSC
Giving NaHCO₃ (sodium bicarbonate) during CPR triggers a chemical reaction that releases CO₂ directly into the bloodstream. The result is a sudden rise in EtCO₂ of 5–15 mmHg — morphologically identical to the ROSC signature.
Bicarbonate rise: occurs within 60 seconds of administration, is transient — EtCO₂ drops back to its original value after 2–3 minutes. No palpable pulse.
True ROSC: EtCO₂ rises suddenly and persists at the higher value. A pulse is palpable, or an organized rhythm appears on the ECG.
Trap 3 — Epinephrine lowers EtCO₂ — it doesn’t mean poor compressions
Giving epinephrine during CPR causes peripheral vasoconstriction — blood is redirected to central organs. A side effect is a transient drop in cardiac output from compressions, and consequently a 3–8 mmHg drop in EtCO₂ over 1–2 minutes after administration.
The paramedic gives epinephrine; 90 seconds later EtCO₂ drops from 22 to 14 mmHg. They respond by swapping the paramedic doing compressions — incorrectly. Compressions are fine; epinephrine caused the drop.
Rule: wait 2–3 minutes after giving epinephrine before evaluating EtCO₂ as an indicator of compression quality.
Trap 4 — Condensation in the waveform tubing
With sidestream capnography, exhaled air passes through a thin tube into the measuring chamber. Exhaled air is saturated with water vapor — at low temperatures (winter calls, transport in a cold ambulance) or during a prolonged resuscitation, water condenses in the tubing.
Result: the tubing becomes partially or completely blocked. The monitor shows either zero EtCO₂ or irregular artifact waveforms — not because the patient isn’t breathing for us, but because the signal never reaches the sensor.
The monitor shows a zero or irregular signal. Yet the patient is visibly breathing, the chest rises, the BVM offers resistance.
Approach: disconnect the tubing from the cannula and blow it out — or replace it with a new one. If the signal returns, the cause was technical.
Prevention: use sidestream tubing with a moisture-trap filter (available for the Corpuls 3, Zoll X Series).
Trap 5 — A falsely low EtCO₂ with correct intubation
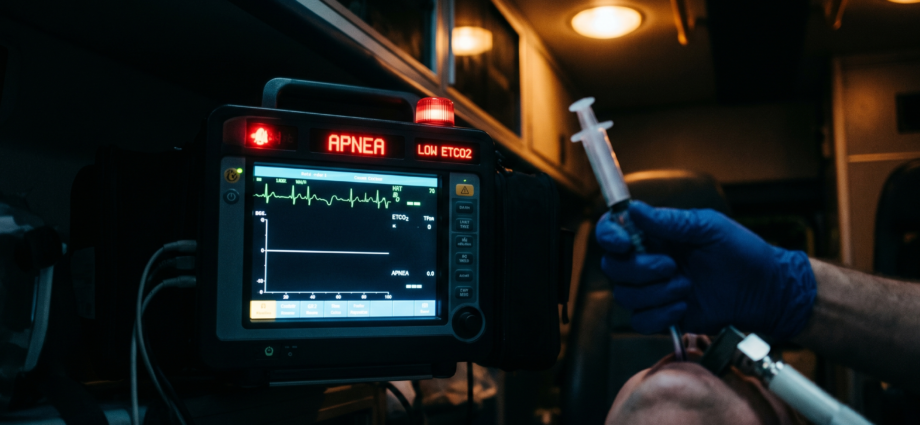
This is the mirror image of traps 1 and 2 — capnography shows a low or zero EtCO₂ despite a correctly placed ET tube. The clinical literature documents cases where clinicians assumed incorrect ET tube placement based on the absence of a capnographic signal, even though the video laryngoscope showed the tube passing through the vocal cords.
Causes of falsely low values with correct intubation:
| Cause | Mechanism | Differentiation |
|---|---|---|
| Cardiac arrest without CPR | No perfusion = no CO₂ transported to the lungs | Start CPR — EtCO₂ will rise if the tube is correct |
| Massive pulmonary embolism | CO₂ doesn’t pass through the obstructed pulmonary circulation | Clinical context + ECG (RBBB, S1Q3T3) |
| Sensor technical fault | Dead battery, IR sensor malfunction, condensation | Replace the tubing, restart the monitor |
| Hyperventilation trap | RR > 20/min — CO₂ exhaled too fast | Reduce RR to 10/min — EtCO₂ will rise |
Summary: five traps and how to tell them apart
| Trap | What the monitor shows | How to tell it apart |
|---|---|---|
| Esophageal intubation | 2–4 waveforms, then zero | Watch for persistence + direct visualization |
| Bicarbonate | Sudden EtCO₂ rise | Transient — drops back, no pulse present |
| Epinephrine | EtCO₂ drop after administration | Time correlation with the dose, not with technique |
| Condensation | Zero or artifact | Blow out/replace the tubing — signal returns |
| Low signal with correct ET tube | Zero or very low | Direct ET tube visualization, start CPR, rule out PE |
- Capnography in EMS: why it’s your second monitor
- The capnographic waveform: reading the patient’s story
- Capnography during CPR: reading resuscitation quality in real time
- Capnography traps: when the waveform lies (this article)
- EtCO₂ and the decision to terminate CPR: when to continue and when not to
- Capnography in the spontaneously breathing patient — opioid intoxication, status epilepticus, DKA