The capnographic waveform:
reading the patient’s story
Every deviation from a normal capnogram means something. Learn to recognize the seven clinically most important patterns a paramedic encounters on calls — and what to look for behind them.
In the first installment we explained what capnography measures and why. Now we get to the heart of it: what a normal waveform looks like, what pathological patterns look like, and — most important in the field — what the paramedic does when they see them on the monitor.
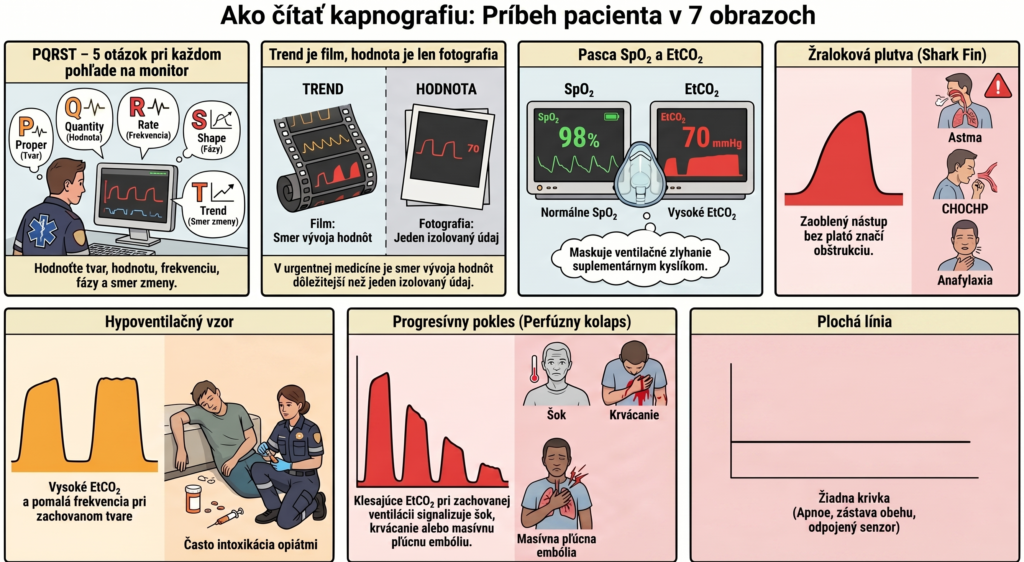
The PQRST system: five questions for every look at the monitor
Before we look at the individual patterns, we need a systematic approach. Just as you don’t look at only one lead when interpreting an ECG, you don’t look at just the number in capnography. I recommend asking yourself five questions each time, in the acronym PQRST — the same letters as in ECG, but with different content:
| Letter | Question | Normal answer |
|---|---|---|
| P | Proper — Is the waveform the correct shape (square)? | Yes — steep upstroke, plateau, steep downstroke |
| Q | Quantity — What is the numeric EtCO₂ value? | 35–45 mmHg |
| R | Rate — What is the respiratory rate from the waveform? | 12–20/min spontaneous; 10–12/min if ventilated |
| S | Shape — Does the waveform have the correct shape at each phase? | Phase I at zero, steep II, horizontal III, steep IV |
| T | Trend — What is the direction of the change in values over time? | Stable, no progressive rise or drop |
Of all five parameters, trend is clinically the most important. A single EtCO₂ value = a photograph. Trend = a film. In emergency medicine, the film is what decides.
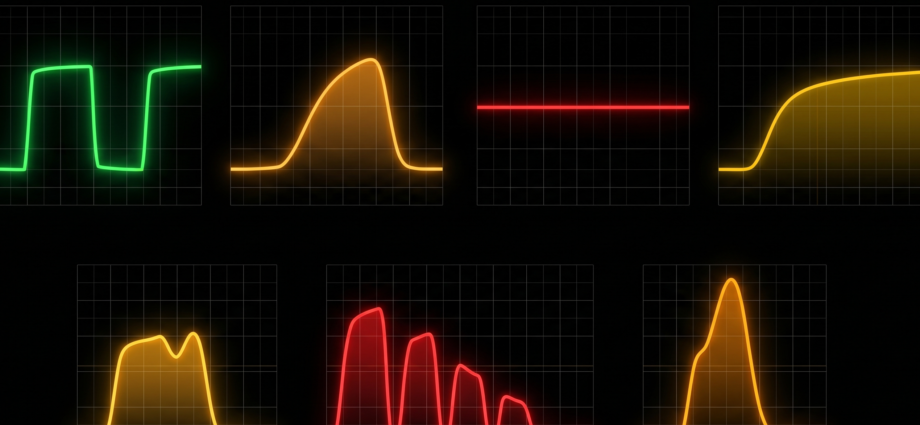
Pattern 1 — The normal waveform
Pattern 2 — Shark fin
The paradox of asthma: in the early stage of an attack, the patient hyperventilates → EtCO₂ is low (25–30 mmHg). If EtCO₂ starts rising toward normal or above it, this is not improvement — it’s exhaustion of the respiratory muscles. The patient can no longer sustain the compensatory hyperventilation effort.
EtCO₂ normalizing or rising during a severe asthma attack = a harbinger of respiratory arrest. Prepare the BVM, consider priority transport.
Pattern 3 — The hypoventilation pattern
The monitor shows: EtCO₂ 62 mmHg, RR 7/min, waveforms spread out, shape preserved.
After applying O₂ 6 L/min, SpO₂ rises to 99% — seemingly a good state. But EtCO₂ continues rising to 68 mmHg. This is a hypoventilation crisis masked by supplemental oxygen. The paramedic gives naloxone 0.4 mg IV — within 90 seconds RR rises to 14/min, EtCO₂ drops to 44 mmHg. Without capnography, the opioid intoxication might have gone unnoticed.
Pattern 4 — The hyperventilation pattern
A diagnosis of hyperventilation syndrome (panic disorder, anxiety) is a diagnosis of exclusion. Low EtCO₂ + fast breathing can be the first sign of sepsis, DKA, or PE.
Never give a paper bag to breathe into (a paper bag = raising CO₂). This practice is outdated, potentially dangerous, and has no place in modern prehospital medicine. Correct approach: EtCO₂ monitoring, rule out an organic cause, an anxiolytic only if you’re confident in the diagnosis.
Pattern 5 — A flat line (apnea / cardiac arrest)
1. Check the cannula / tubing / connection — is it physically intact?
2. Is the patient breathing? → Do you see chest movement, hear breathing?
3. If not breathing → check for a pulse → if none → CPR. In an intubated patient: rule out esophageal placement (laryngoscope, direct visualization).
4. Never start by assuming a technical fault until you’re certain the patient is breathing and has a pulse.
Pattern 6 — Elevated baseline (CO₂ rebreathing)
Pattern 7 — Progressive EtCO₂ decline (perfusion collapse)
Putting it all together — a quick reference table
| Pattern | EtCO₂ | RR | Shape | Think of |
|---|---|---|---|---|
| Normal | 35–45 | 12–20 | Square | Physiological state |
| Shark fin | N / ↑ | ↑ | Rounded, no plateau | Asthma, COPD, anaphylaxis |
| Hypoventilation | ↑↑ | ↓ | Square, spread out | Opioids, BZDs, airway depression |
| Hyperventilation | ↓↓ | ↑↑ | Square, tight | Anxiety, DKA, sepsis, PE |
| Flat line | 0 | 0 | None | Apnea, arrest, esophageal intubation, technical fault |
| Elevated baseline | N | N | Square, baseline above 0 | CO₂ rebreathing, circuit fault |
| Progr. decline | ↓ progr. | N / ↑ | Square, declining | Shock, massive PE, hemorrhage |
Capnography and SpO₂ — reading them together
A final clinical note: these two monitors complement each other, and their combined interpretation is stronger than either alone. Here are four combinations every paramedic must know:
EtCO₂ normal + SpO₂ normal: Both ventilation and oxygenation are fine. Watch the trend.
EtCO₂ high + SpO₂ normal: Hypoventilating, but SpO₂ is still maintained — typically with supplemental O₂. The most dangerous combination — oxygenation masks ventilatory failure. Act on the EtCO₂, not the SpO₂.
EtCO₂ low + SpO₂ low: Serious failure — either hypoperfusion (shock, arrest) or both poor ventilation and oxygenation simultaneously.
EtCO₂ low + SpO₂ normal: Hyperventilating with adequate oxygenation — DKA, panic, pain, PE.
- Capnography in EMS: why it’s your second monitor
- The capnographic waveform: reading the patient’s story (this article)
- Capnography during CPR: reading resuscitation quality in real time
- Capnography traps: when the waveform lies — esophageal intubation, bronchospasm, artifact
- EtCO₂ and the decision to terminate CPR: when to continue and when not to
- Capnography in the spontaneously breathing patient — opioid intoxication, status epilepticus, DKA
- Bhavani-Shankar K, Philip JH. Defining Segments and Phases of a Time Capnogram. Anesth Analg. 2000;91(4):973–977. doi:10.1097/00000539-200010000-00040
- Silvestri S, et al. The Effectiveness of Out-of-Hospital Use of Continuous End-Tidal Carbon Dioxide Monitoring on the Rate of Unrecognized Misplaced Intubation. Ann Emerg Med. 2005;45(5):497–503.
- Hunter CL, Silvestri S, Ralls G, et al. A Prehospital Screening Tool Utilizing End-Tidal Carbon Dioxide Predicts Sepsis and Severe Sepsis. Am J Emerg Med. 2016;34(5):813–819.
- EMCrit Project — Weingart S. Waveform Capnography in the Intubated Patient. emcrit.org. Updated December 2024.
- LITFL — Life in the Fast Lane. Capnography Waveform Interpretation. litfl.com. Updated 2024.
- OpenAnesthesia. Capnography. openanesthesia.org. Updated 2026.
- Don’t Forget the Bubbles — Hibberd O. A Beginner’s Guide to Capnography. dontforgetthebubbles.com. January 2025.
- Medscape. End-Tidal Capnography: Background, Indications, Technical Considerations. emedicine.medscape.com.
- EMS1 Staff. Normal vs. Abnormal Capnography: What EMS Paramedics Need to Know. ems1.com. July 2025.
Paramedic with more than 15 years of experience in prehospital emergency care, RZP Leopoldov. Administrator and editor of zachranarjecool.eu. Author of the Capnography in EMS series.