
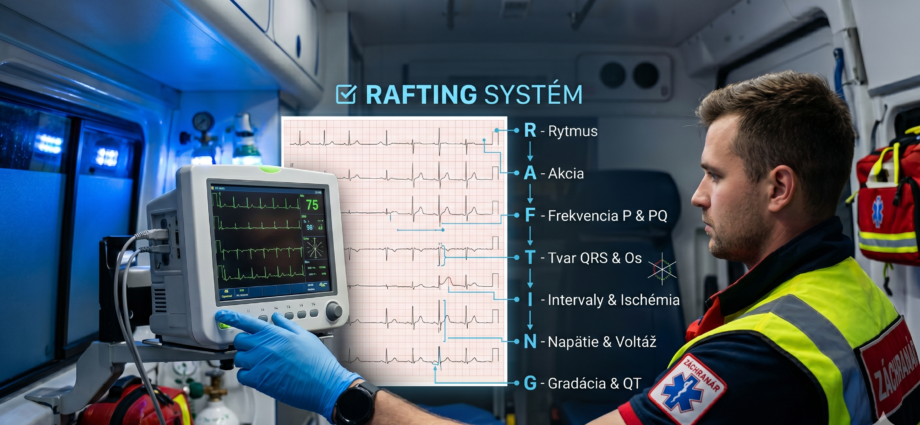
The RAFTING System, Steps “I”, “N” and “G”: Ischaemia, Voltage, QT and General Impression
The last three steps of the algorithm keep a paramedic, during a quick analysis, from missing ST-segment changes, unusual voltage, or a prolonged QT interval.
Steps R, A, F and T described rhythm, rate, the atria and the ventricles in terms of QRS width and axis. Three letters remain to complete the RAFTING algorithm: I (Intervals & Ischemia), N (Numbers & Voltage) and G (General Impression & QT). In the field these are often the steps that decide what the patient receives that same day: transport to a cardiac centre, monitored transport to hospital, or a check of electrolytes and of drugs that prolong the QT interval.
Where we are in the RAFTING system
The introductory part of the series defines RAFTING as a sequential checklist. The preceding articles describe steps R, A, F and T. This summary article covers the remaining three steps together: I (ST segment and T wave), N (amplitude and voltage) and G (QT interval and general impression). The combined format is chosen because these are the steps most often skipped in practice: the ST segment grabs attention first, while voltage and QT are frequently not assessed at all.
Illustrative scenario. The patient briefly lost consciousness at home and is now alert, BP 118/74, SpO₂ 97 %, heart rate 54/min. She takes several medications, among them drugs that can prolong the QT interval. The ECG shows sinus rhythm, a narrow QRS and no ST elevation. The QT is 560 ms, about 530 ms after correction.
Decision: without steps I, N and G the tracing would pass as “no findings”. The crew applies defibrillator pads, keeps the patient on the monitor, sends the tracing to the physician and gives no further QT-prolonging drugs without an order. Transport is monitored.
Step I: ST segment and T wave (Intervals & Ischemia)
Step I assesses repolarisation: the position of the ST segment relative to the isoelectric line and the shape of the T wave. ESC guidelines recommend recording and interpreting a 12-lead ECG within 10 minutes of first medical contact when acute coronary syndrome is suspected [5]. In prehospital care this is the most commonly examined step, and it is interpreted using the criteria of the Fourth Universal Definition of Myocardial Infarction [4].
| Finding (in two contiguous leads) | Criterion | Note |
|---|---|---|
| ST elevation at the J point, all leads except V2–V3 | 1 mm or more | new elevation |
| ST elevation in V2–V3, man aged 40 or older | 2 mm or more | new elevation |
| ST elevation in V2–V3, man under 40 | 2.5 mm or more | new elevation |
| ST elevation in V2–V3, woman | 1.5 mm or more | new elevation |
| Horizontal or downsloping ST depression | 0.5 mm or more | ischaemia, or a reciprocal change |
| T-wave inversion with a prominent R wave | more than 1 mm | assess with dynamics |
The values come from the Fourth Universal Definition of Myocardial Infarction [4]. They apply to a new change with typical symptoms; with left bundle branch block and paced rhythm other criteria are used (see the article on step T).
ST-segment elevation may also be caused by pericarditis, early repolarisation, a left ventricular aneurysm, bundle branch block, left ventricular hypertrophy and hyperkalaemia [1]. Conversely, ST depression in V1–V3 may be the mirror image of a posterior infarction; in that case additional leads V7–V9 are recommended [4]. With an inferior infarction, right-sided precordial leads V3R and V4R are considered [5]. When the history is typical but the ECG is unclear, repeat the recording; the dynamics of change carry more weight than a single tracing.
The T wave is assessed together with the ST segment and in context. Tall, symmetrical T waves may be a hyperacute finding in the early phase of infarction, but peaked T waves also occur in hyperkalaemia, which the ERC lists among the reversible causes of cardiac arrest and deteriorating arrhythmias [7]. The distinction rests on the clinical picture and the dynamics, not on the shape of a single wave.
When acute coronary syndrome is suspected, record a 12-lead ECG and send it to the cardiac centre via the CDS App. The decision to activate an intervention rests with the cardiologist and the physician.
Step N: voltage and amplitude (Numbers & Voltage)
The first practical action is to check the calibration: the standard is 10 mm per 1 mV at a paper speed of 25 mm/s. With a wrong calibration, amplitudes appear larger or smaller than they are, and the whole of step N loses its meaning.
High voltage. Left ventricular hypertrophy is suggested, for example, when the S wave in V1 plus the R wave in V5 or V6 exceeds 35 mm (the Sokolow–Lyon criterion). Voltage criteria have high specificity but low sensitivity, so a normal result does not exclude hypertrophy [2]. In hypertrophy, secondary ST-T changes may also appear and affect the assessment in step I.
Low voltage. Diffusely low voltage occurs without disease, for example in obesity, but may also be a warning sign. In the clinical context of hypotension and tachycardia, think of pericardial effusion with tamponade and of tension pneumothorax; the ERC lists them among the reversible causes of cardiac arrest [7]. Low voltage alone is not a diagnosis; it shows where the clinical examination should direct attention.
Step G: QT interval and general impression (General Impression & QT)
The last step has two parts. The first is measuring the QT interval; the second is joining all findings to the patient: does the ECG fit the clinical picture?
- Measure the QT from the start of the QRS to the end of the T wave in lead II or V5, where the end of the T wave is best defined.
- Convert it to QTc. Bazett’s formula (QTc = QT / √RR, RR in seconds) is inaccurate outside a heart rate of 60–100/min and overcorrects at fast rates; Fridericia’s formula (QT / ∛RR) is usually more accurate. Many devices already print a QTc value, but that does not replace your own check.
- With a QRS of 120 ms or more, the QT is overestimated by the widened complex; the usual QTc limits do not apply here [3].
- Check for a U wave and the T-wave shape: a flat or biphasic T wave and a prominent U wave are associated with hypokalaemia and a higher risk of arrhythmia [3].
| QTc | Interpretation | What to do |
|---|---|---|
| up to about 450 ms (men), 460 ms (women) | Normal | Move on to the general impression. |
| above this limit | Prolonged QT | Check drugs, electrolytes and bradycardia; send the tracing to the physician. |
| above 500 ms | High risk of torsades de pointes | Keep the monitor and defibrillator at hand; give no QT-prolonging drugs without a physician’s order. |
Upper limits of QTc vary in the literature; values around 450 ms for men and 460 ms for women are described in the AHA/ACCF/HRS statement [3]. A QTc above 500 ms, or an increase of more than 60 ms from baseline, is associated with a higher risk of torsades de pointes according to the AHA/ACCF statement [6]. In polymorphic ventricular tachycardia of the torsades type with instability, the approach is that for unstable ventricular tachycardia; specific treatment is decided by the physician [7].
Before closing the assessment, ask three questions: Does the ECG match how the patient looks? Is any subtle finding merely an artefact or the result of swapped electrodes? What if the tracing shows only mild changes but the patient has a marked clinical burden? The ECG never replaces examining the patient; when the two disagree, the clinical picture prevails.
RAFTING at a glance
| Step | Question | Warning finding |
|---|---|---|
| R | Is the rhythm regular and sinus? | irregular rhythm, pauses, ventricular rhythm |
| A | What is the rate? | marked bradycardia or tachycardia with instability |
| F | Is there a P wave before every QRS, and what is the PR interval? | Mobitz II or 2:1 AV block, short PR with tachycardia |
| T | What is the QRS width and shape, and the axis? | wide QRS with tachycardia, new bundle branch block with symptoms |
| I | What do the ST segment and T wave look like? | new ST elevation, reciprocal depression, hyperacute T waves |
| N | Is the calibration correct, and what is the voltage? | diffusely low voltage with hypotension and tachycardia |
| G | What is the QTc, and does the ECG fit the clinical picture? | QTc above 500 ms, mismatch with the clinical picture |
How to document steps I, N and G
“ECG no findings, patient stable.”
“12-lead ECG at 09:12: sinus rhythm 54/min, narrow QRS, no ST elevation, voltage normal, QT 560 ms, QTc about 530 ms (Bazett). Patient monitored, defibrillator pads applied, tracing sent to the physician at 09:15.”
The scope of practice of a paramedic, including recording and assessing the ECG while providing emergency care, is regulated by Decree of the Ministry of Health of the Slovak Republic No. 321/2005 Coll., as amended. The diagnostic conclusion and specific treatment belong to the physician; verify the wording of the regulation in its current version on slov-lex.sk.
Decree of the Ministry of Health of the Slovak Republic No. 321/2005 Coll.
Practical implications for the paramedic
1. Step I: judge ST elevation by the criteria for the given lead, age and sex; when acute coronary syndrome is suspected, send the tracing to the cardiac centre via the CDS App.
2. ST depression in V1–V3 may hide a posterior infarction; with an inferior infarction, think of the right-sided precordial leads.
3. Peaked T waves have several causes, including hyperkalaemia; the clinical picture and the dynamics decide.
4. Start step N by checking the calibration, 10 mm/mV and 25 mm/s.
5. Step G: measure and correct the QT; a QTc above 500 ms is a sign of high risk, not a diagnosis.
6. At the end of the algorithm, check that the ECG fits the patient. The ECG does not replace the examination.
- The biological basis of the ECG
- Determining the electrical axis of the heart
- The RAFTING system: algorithmic ECG interpretation
- Step “R” — heart rhythm analysis
- Step “A” — heart rate
- Step “F” — atrial activity and AV conduction
- Step “T” — QRS morphology and electrical axis
- Steps “I”, “N” and “G” — ischaemia, voltage, QT and general impression (this article)
- Wagner GS, Macfarlane P, Wellens H, Josephson M, Gorgels A, Mirvis DM, et al. AHA/ACCF/HRS recommendations for the standardization and interpretation of the electrocardiogram: part VI: acute ischemia/infarction. Circulation. 2009;119(10):e262–e270. doi:10.1161/CIRCULATIONAHA.108.191098
- Hancock EW, Deal BJ, Mirvis DM, Okin P, Kligfield P, Gettes LS, et al. AHA/ACCF/HRS recommendations for the standardization and interpretation of the electrocardiogram: part V: electrocardiogram changes associated with cardiac chamber hypertrophy. Circulation. 2009;119(10):e251–e261. doi:10.1161/CIRCULATIONAHA.108.191097
- Rautaharju PM, Surawicz B, Gettes LS, Bailey JJ, Childers R, Deal BJ, et al. AHA/ACCF/HRS recommendations for the standardization and interpretation of the electrocardiogram: part IV: the ST segment, T and U waves, and the QT interval. Circulation. 2009;119(10):e241–e250. doi:10.1161/CIRCULATIONAHA.108.191096
- Thygesen K, Alpert JS, Jaffe AS, Chaitman BR, Bax JJ, Morrow DA, et al. Fourth Universal Definition of Myocardial Infarction (2018). Circulation. 2018;138(20):e618–e651. doi:10.1161/CIR.0000000000000617
- Byrne RA, Rossello X, Coughlan JJ, Barbato E, Berry C, Chieffo A, et al. 2023 ESC Guidelines for the management of acute coronary syndromes. Eur Heart J. 2023;44(38):3720–3826. doi:10.1093/eurheartj/ehad191
- Drew BJ, Ackerman MJ, Funk M, Gibler WB, Kligfield P, Menon V, et al. Prevention of torsade de pointes in hospital settings: a scientific statement from the American Heart Association and the American College of Cardiology Foundation. Circulation. 2010;121(8):1047–1060. doi:10.1161/CIRCULATIONAHA.109.192704
- Soar J, Böttiger BW, Carli P, Couper K, Deakin CD, Djärv T, et al. European Resuscitation Council Guidelines 2021: Adult advanced life support. Resuscitation. 2021;161:115–151. doi:10.1016/j.resuscitation.2021.02.010
- Decree of the Ministry of Health of the Slovak Republic No. 321/2005 Coll. on the scope of practice of certain health professions, as amended.